Tim Black
[Static Graph] - Đề trong IELTS Ready Premium
Bài Writing Task 1 Academic đầu tiên.
Mình mới viết lại lần đầu sau 5-6 năm không đụng đến. Cơ mà lần cuối cùng mình đụng đến thì Writing của lúc đó cũng tầm 6.0 thôi, nên mọi người cứ nhận xét thoải mái nhé để từ từ mình rút kinh nghiệm và phát triển khả năng viết. 🥰
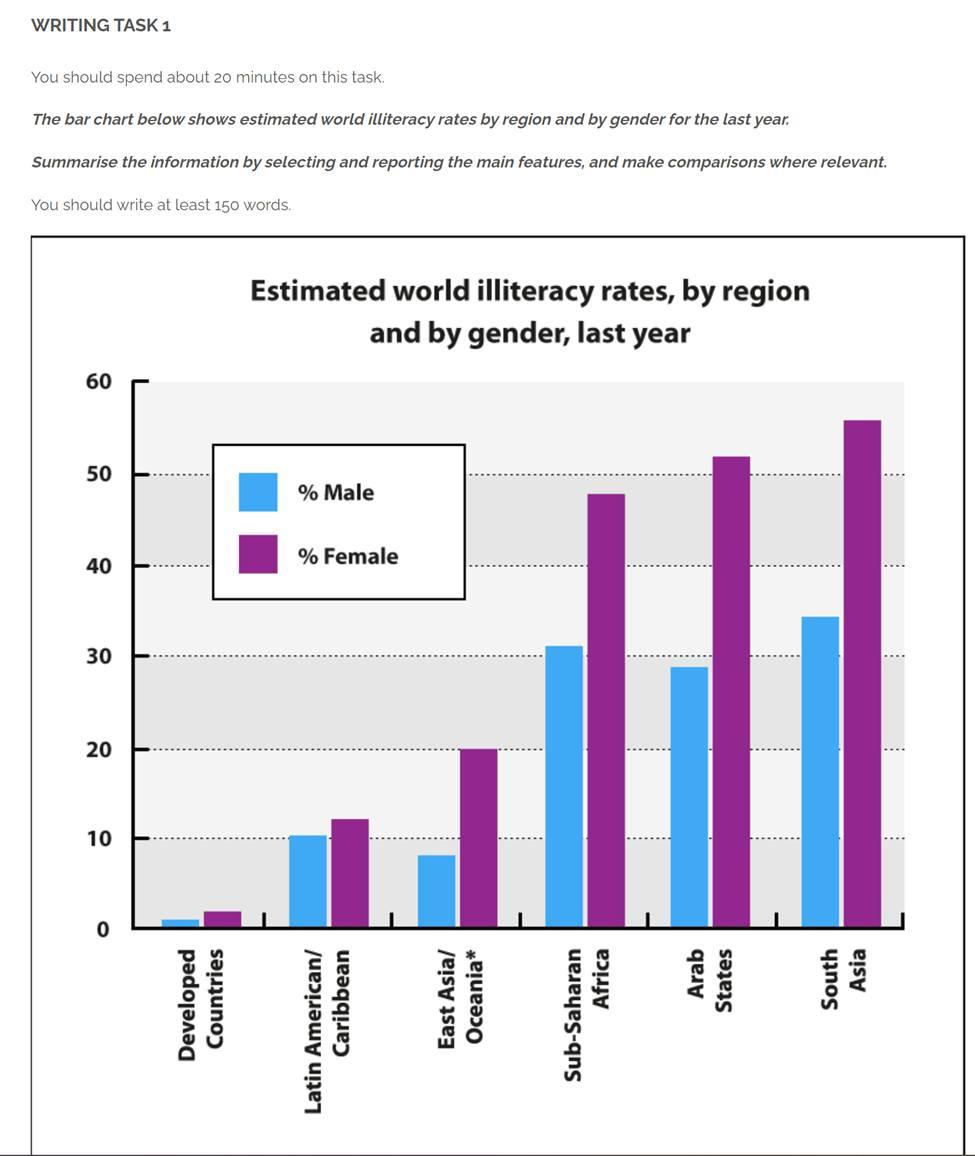
The bar chart below shows estimated world illiteracy rates by region and by gender for the last year.
Summarise the information by selecting and reporting the main features, and make comparisons where relevant.
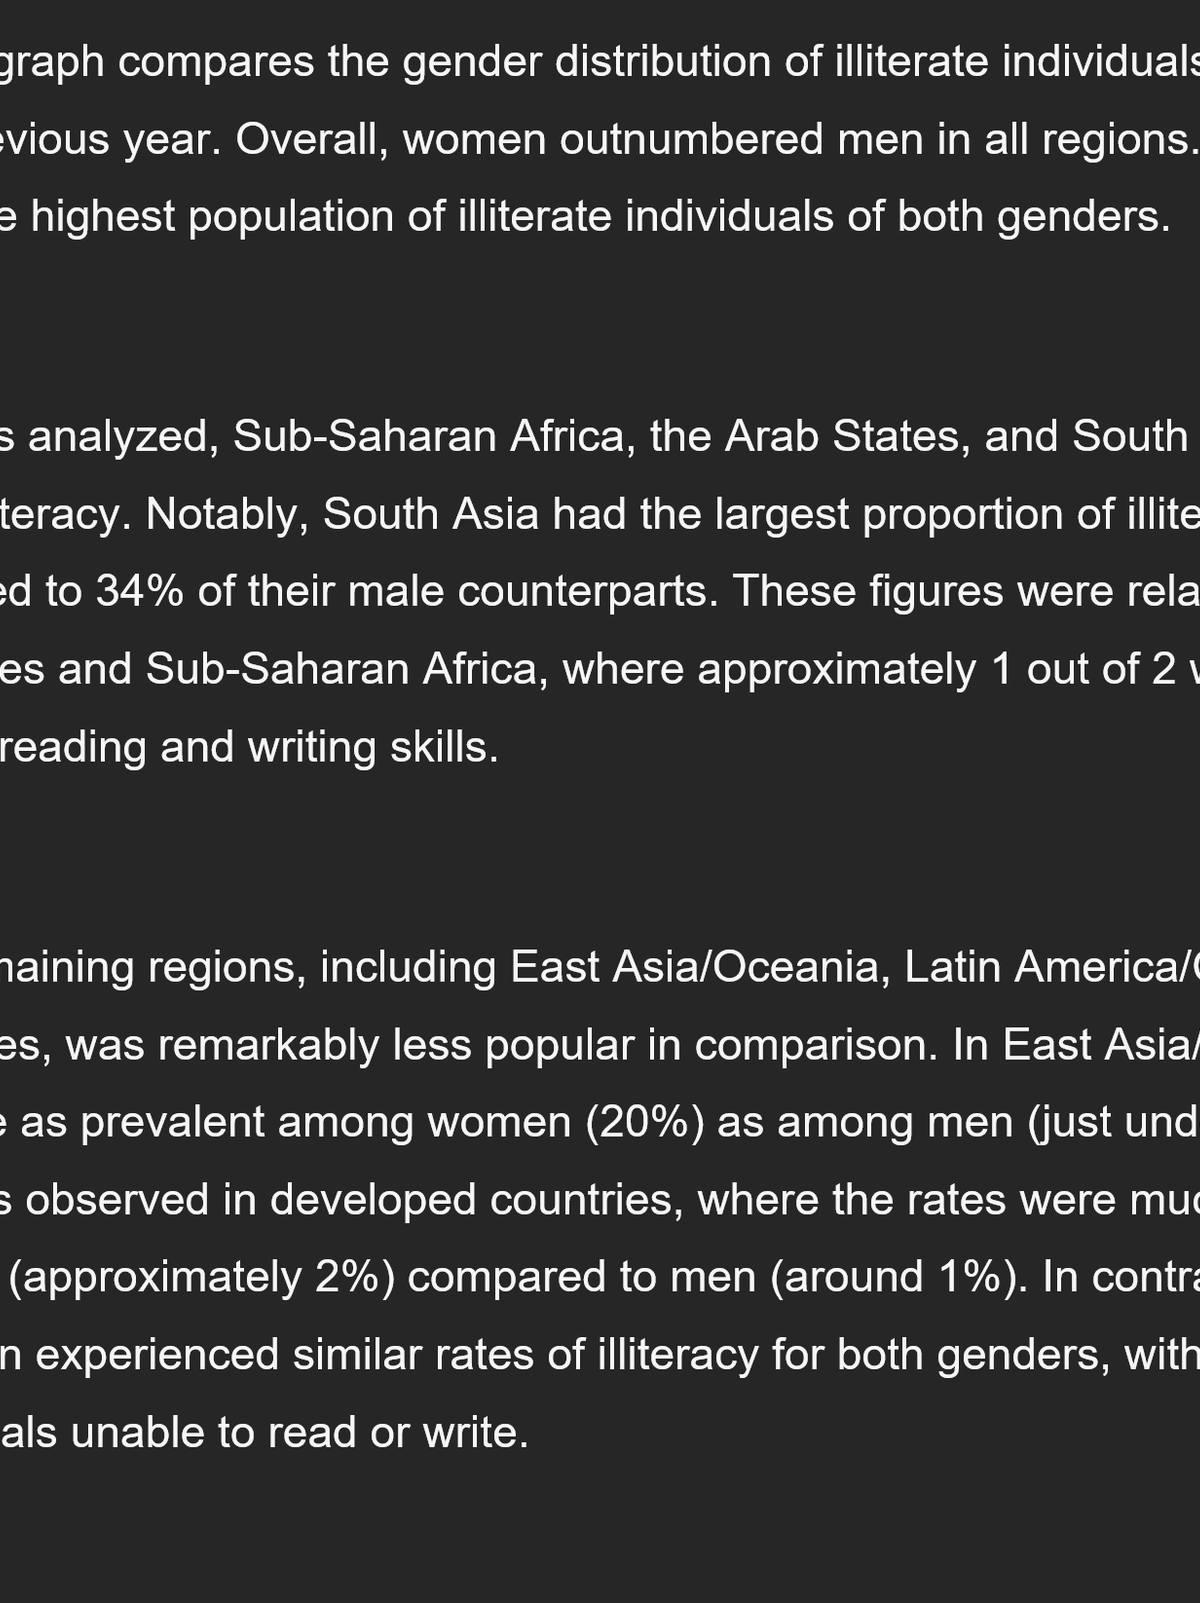
The provided bar graph compares the gender distribution of illiterate individuals in six distinct areas from the previous year. Overall, women outnumbered men in all regions. Furthermore, South Asia had the highest population of illiterate individuals of both genders.
Among the regions analyzed, Sub-Saharan Africa, the Arab States, and South Asia reported the highest rates of illiteracy. Notably, South Asia had the largest proportion of illiterate females, with 56% compared to 34% of their male counterparts. These figures were relatively similar to those of Arab States and Sub-Saharan Africa, where approximately 1 out of 2 women and 1 in 3 men lacked basic reading and writing skills.
Illiteracy in the remaining regions, including East Asia/Oceania, Latin America/Caribbean, and developed countries, was remarkably less popular in comparison. In East Asia/Oceania, illiteracy was twice as prevalent among women (20%) as among men (just under 10%). A similar pattern was observed in developed countries, where the rates were much lower but still double for women (approximately 2%) compared to men (around 1%). In contrast, Latin America/Caribbean experienced similar rates of illiteracy for both genders, with approximately one in ten individuals unable to read or write.
(192 words)
Comments (0)
No comments yet. Be the first!
Join the conversation
Log in to comment